Operational performance

04 Operational performance

Next
level


Scroll

Goodman delivered a strong FY20 result. While the pandemic brought some challenges, it also accelerated key societal changes that are well aligned with Goodman’s existing direction and that of our customers. During the year, customer demand for our well-located industrial properties translated into more development activity, high occupancy, rental growth, increased assets under management and, ultimately, strong returns across our property investment and management businesses.

Own

Own

Goodman Business Park, Greater Tokyo, Japan.

Top 20 global customers

(by net income – look through basis).

  • 7.2Amazon
  • 2.3Deutsche Post (DHL)
  • 1.7A.P. Moller – Maersk
  • 1.6Japan Post (Toll)
  • 1.3Kimberly-Clark Corporation
  • 1.3SF Express
  • 1.1Iron Mountain
  • 1.1Georgia-Pacific
  • 1.1BMW Group
  • 1.0JD.com
  • 1.0DB Schenker
  • 0.9Equinix
  • 0.8Kuehne + Nagel
  • 0.7syncreon
  • 0.7Omlog
  • 0.7Coca-Cola Amatil
  • 0.7Linfox
  • 0.6IVE Group
  • 0.6Coles Group
  • 0.6Mainfreight

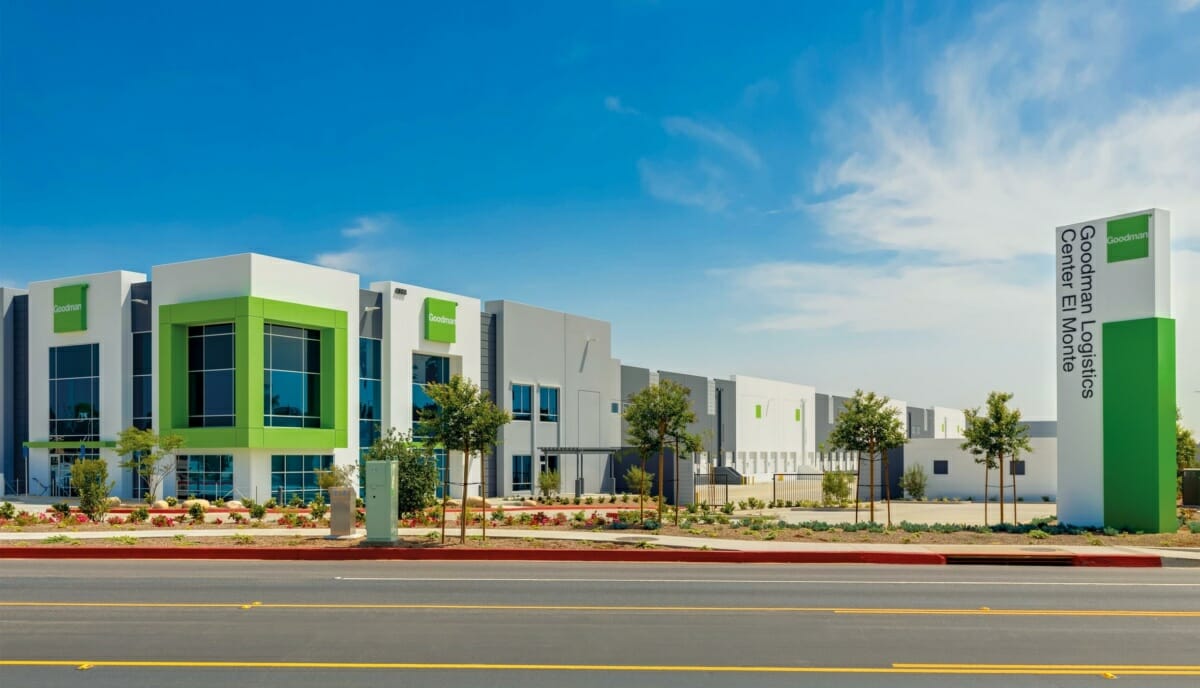
A focus on infill locations

Customer demand for space in Goodman’s strategic locations continued to grow due to the ongoing structural changes brought about by changes in consumer behaviour. These changes accelerated during the pandemic, as logistics and warehousing provided critical infrastructure for distribution of essential goods, and more consumers shifted to online shopping.

Over the medium to longer term, we expect significant opportunities to arise through planning outcomes across our $51.6 billion portfolio. This should facilitate redevelopment of higher intensity multi-storey logistics facilities and data centres as well as change of use into residential zoning. We are continually progressing these opportunities through various planning stages.

Property investment highlights include:

  • High occupancy maintained at 97.5% and weighted average lease expiry of 4.5 years
  • 3.0 million sqm leased, equating to $401.7 million of annual rental property income across the Group and Partnerships
  • Like-for-like net property income growth of 3.0%*.

* Excludes net property income from directly held assets.

With more than 1,700 customers, Goodman has a diverse range of global and local customers across industries including e-commerce, logistics, retail, consumer goods, automotive, pharmaceutical and technology.

Goodman Commerce Center, Eastvale, California, USA.
Goodman Commerce Center Eastvale, California, USA.
Develop

Develop

Artist's impression of Purfleet Commercial Park, London, UK.

Work in progress ($bn)

3.4
2016
3.5
2017
3.6
2018
4.1
2019
6.5
2020
>7
1HFY21 (F)

Strong growth in workbook to $6.5 billion

Development activity has been a clear driver of this year’s strong results. Our work in progress reached $6.5 billion and we expect it to exceed $7 billion in the first half of FY21.

We have seen solid margins and pre-leasing activity, while the average lease term of 15.1 years is the longest it’s ever been. We expect these longer leases to continue, as customers choose higher value infill locations and invest more in technology at their facilities.

Our development projects have increased in both scale and value, with the average time for developments in progress increasing to about 17 months. This gives greater visibility over development activities going forward.

Other development highlights include:

  • Globally diversified workbook across 46 projects with a forecast yield on cost of 6.5%
  • Commencing $4.5 billion in new developments with 79% pre-leased
  • Completing development projects worth $2.4 billion with 85% leased.
Manage

Manage

Assets under management

29.3
34.1
2016
30.5
34.6
2017
35.1
38.3
2018
42.9
46.2
2019
48.0
51.6
2020

Development completions and higher valuations drive strong performance

Goodman delivered average total returns of 16.6% to our capital Partners in their respective financial years, continuing the trend of the last five years for double digit returns.

External assets under management grew 12% over FY20 to $48 billion due to development completions and valuation gains resulting from cap rate compression. The impact of COVID-19 further increased demand for industrial and logistics assets, continuing to generate positive revaluations, which grew by $2.9 billion this year.

The Group has invested more than $1.1 billion in its Partnerships over the last two years, including $0.3 billion in FY20. This was mainly to fund development opportunities, as well as incremental acquisitions of properties with redevelopment opportunities over the longer term.

Other management highlights include:

  • Management earnings up 9%, enhanced by the positive performance of the Partnerships
  • Average Partnership gearing of 19.9%
  • Weighted average cap rate compression of 23bps to 4.9% over the year
  • $16.3 billion available in equity commitments*, cash and debt.

* Partnership investments are subject to Investment Committee approval.